Population of Telangana
- Telangana is the 29th state of India, formed on the 2nd of June 2014.
- The state has an area of 1,12,077 Sq. Km. and has a population of 3,50,03,674.
- The Telangana region was part of the Hyderabad state from Sept 17th 1948 to Nov 1st 1956, until it was merged with Andhra state to form the Andhra Pradesh state.
- After decades of movement for a separate State, Telangana was created by passing the AP State Reorganization Bill in both houses of Parliament.
- Telangana is surrounded by Maharashtra and Chhattisgarh in the North, Karnataka in the West and Andhra Pradesh in the South and East directions.
- Major cities of the state include Hyderabad, Warangal, Nizamabad and Karimnagar
- The people of the state are predominantly residing in rural areas with 61.12% and the rest of 38.88% are residing in urban areas.
- The overall growth of total population during the decade 2001 to 2011 is 13.58%, whereas it was 18.77% in the preceding decade.
- The growth of the population in urban areas has been witnessing a significant increase.
- Urban population in the State grew by 38.12% during the decade 2001 to 2011 as compared with 25.13% in the preceding decade.
- In sharp contrast, rural population in the state grew by a modest 2.13% as per the 2011 census, which is much higher than the United Nations estimates of world population growth at 1.23%.
- Around 30% of total urban population is residing in the capital city of Hyderabad alone.
Sex Ration of Population of Telangana
- The sex ratio is defined as the number of females per 1,000 males.
- This ratio for the state is 988 according to 2011 Census.
- One distinguishing feature is that the sex ratio in the districts of Nizamabad, Adilabad, Karimnagar and Khammam is over 1,000.
- The sex ratio has been witnessing an improvement in the State from 967 in 1991 to 971 in 2001 and further to 988 in 2011.
- Despite a favorable sex ratio of the total population, the sex ratio of children in the age group of 0-6 years is declined from 957 in 2001 to 932 in 2011. T
- he sex ratio of the SC population at 1,008 in 2011 is much higher than the State average of 988 in all districts, except Rangareddy, Hyderabad and Mahabubnagar districts.
- The sex ratio of ST population at 977 is marginally lower than the State average of 988, but it is higher in Adilabad, Karimnagar, Nizamabad and Khammam districts.
Density of the Population of Telangana
- The density of population is defined, in general, as average number of persons residing per square kilometer of area.
- The density of population in the State ranges from 170 to 18,172 per square kilometer.
- Adilabad district has the lowest density of 170 per sq. kilometer and Hyderabad district with highest density of 18,172 per sq. kilometer.
- The districts of Adilabad, Khammam and Mahabubnagar have lower density of population with 170, 197 and 220 per sq. kilometer respectively, as compared with the State average of 312 per sq. kilometer.
Literacy Rate OF Population of Telangana
- According to the Census of India, the literacy rate is defined as the total percentage of the population of an area at a particular time, aged seven years or above who can read and write with understanding.
- The literacy rate of the State as per 2011 census is 66.54%.
- Male literacy and female literacy are 75.04% and 57.99%, respectively.
- Hyderabad district is highest with 83.25% and Mahabubnagar district at lowest with 55.04%,
Social Composition of Population of Telangana
- The population of the State consists predominantly of backward classes scheduled castes and scheduled tribes.
- Out of the total population of the State, scheduled castes constitute 15.45% and the scheduled tribes 9.08%.
- There has been a significant increase in the percentage of tribal population in total population from 2.81% in 1961 to 8.19% in 1981 and further to 9.08% in 2011.
Growth and Level of composition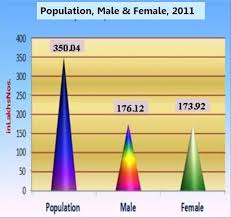
- Urban population, according to 2011 census, is 136.09 lakhs, whereas it was 98.53 lakhs in 2001, increased by 36% over the decade in the State.
- Hyderabad is a hundred percent urban district but the city of Hyderabad spreads much beyond the district boundary into the neighbouring Rangareddy district.
- This has made Rangareddy, which surrounds Hyderabad, as the next highly urbanized district with 70.22% urban population.
Population of Telangana Statistics
| 1 | Area | 112,077 Sq. Kms. |
| 2 | Districts | 31 |
| 3 | Population
Male Female |
350.04 Lakhs
176.12 Lakhs 173.92 Lakhs |
| 4 | Sex Ratio (Female per 1000 Males) | 988 Ratio |
| 5 | Density of Population | 312 per Sq. Km |
| 6 | Decadal Growth Rate (2001-2011) | 13.58 Rate |
| 7 | Rural Population
Rural Population Male Rural Population Female |
213.95 Lakhs
107.05 Lakhs 106.90 Lakhs |
| 8 | Rural Population Sex Ratio (Female per 1000 Males) | 999 Ratio |
| 9 | Rural to Total Population | 61.12 % |
| 10 | Urban Population
Urban Population Male Urban Population Female |
136.09 Lakhs
69.07 Lakhs 67.02 Lakhs |
| 11
|
Urban Population Sex Ratio (Female per 1000 Males) | 970 Ratio |
| 12 | Urban to Total Population | 38.88 % |
| 13 | SC Population
SC Population Male SC Population Female |
54.09 Lakhs
26.93 Lakhs 27.16 Lakhs |
| 14 | ST Population
ST Population Male ST Population Female |
31.78 Lakhs
16.08 Lakhs 15.70 |
| 15 | Child Population (0-6 years)
Child Population (0-6 years) Male Child Population (0-6 years) Female Child to Total Population |
38.99 Lakhs
20.18Lakhs 18.81 Lakhs 11.14 % |
| 16 | Child Sex Ratio (Female per 1000 Males) | 932 Ratio |
| 17 | Literates
Literates Male Literates Female Literacy Rate Literacy Rate Male Literacy Rate Female |
206.97 Lakhs
117.02 Lakhs 89.05 Lakhs 66.54 % 75.04 % 57.99 % |
| 18 | Total Workers
Main Workers Marginal Workers |
163.42 Lakhs
137.20 Lakhs 26.22 Lakhs |
| 19 | Members of Parliament (MPs)
Members of Legislative Assembly (MLAs) |
17
120 |
Some Districts Statics of Population of Telangana
| Name | Status Population Census 2011-03-01 |
| Adilabad District | 2,741,239 |
| Hyderabad District | 3,943,323 |
| Karimnagar District | 3,776,269 |
| Khammam District | 2,797,370 |
| Mahbubnagar District | 4,053,028 |
| Medak District | 3,033,288 |
| Nalgonda District | 3,488,809 |
| Nizamabad District | 2,551,335 |
| Rangareddy District | 5,296,741 |
| Warangal District | 3,512,576 |
| Telangana State | 35,193,978 |
National Population Policy
- As per the latest World Population Prospects released by United Nations (revision 2015), the estimated population of India will be 1419 million approximately whereas China’s population will be approximately 1409 million, by 2022.
- In spite of the perceptible decline in Total Fertility Rate (TFR) from 3.6 in 1991 to 2.3 in 2013, India is yet to achieve replacement level of 2.1.
- Twenty four states/UTs have already achieved replacement level of TFR by 2013, while states like UP and Bihar with large population base still have TFR of 3.1 and 3.4 respectively.
- The other states like Jharkhand (TFR 2.7), Rajasthan (TFR 2.8), Madhya Pradesh (TFR 2.9), and Chhattisgarh (TFR 2.6) continue to have higher levels of fertility and contribute to the growth of population.
- The National Population Policy 2000 is uniformly applicable to the whole country. In pursuance of this policy, Government has taken a number of measures under Family Planning Programme and as a result, Population Growth Rate in India has reduced substantially which is evident from the following:-
- The percentage decadal growth rate of the country has declined significantly from 21.5% for the period 1991-2001 to 17.7% during 2001-2011.
- Total Fertility Rate (TFR) was 3.2 at the time when National Population Policy, 2000 was adopted and the same has declined to 2.3 as per Sample registration Survey (SRS) 2013 conducted by the Registrar General of India.
TSPSC Notes brings Prelims and Mains programs for TSPSC Prelims and TSPSC Mains Exam preparation. Various Programs initiated by TSPSC Notes are as follows:-
- TSPSC Mains Tests and Notes Program
- TSPSC Group I Prelims Exam 2024- Test Series and Notes Program
- TSPSC Prelims and Mains Tests Series and Notes Program
- TSPSC Detailed Complete Prelims Notes